Azure Data Factory Basics - Exploring the Azure Data Factory layout
@20aman Jan 08, 2020In this post, we will be looking at the Data factories section in Azure in detail.
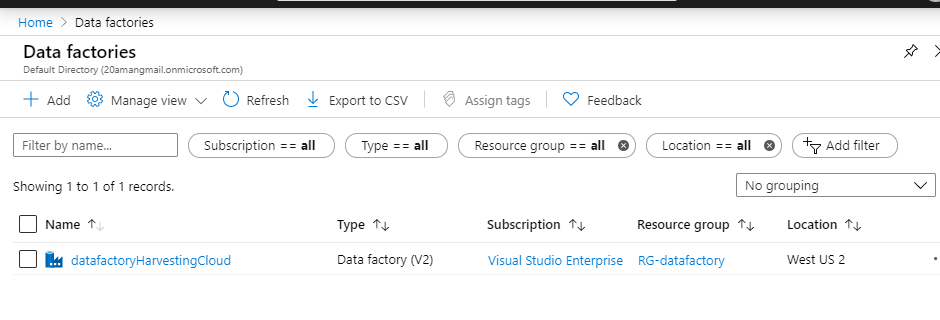
To manage the data factory pipelines, go to All resources -> Data factories. You will see all the data factories have been added or created. Select the data factory you want to manage.

Once you select the data factory, it will open the new window (known as a blade in Azure) where you can manage your Data Factory.

Let’s discuss a few sections of the Data Factory page.
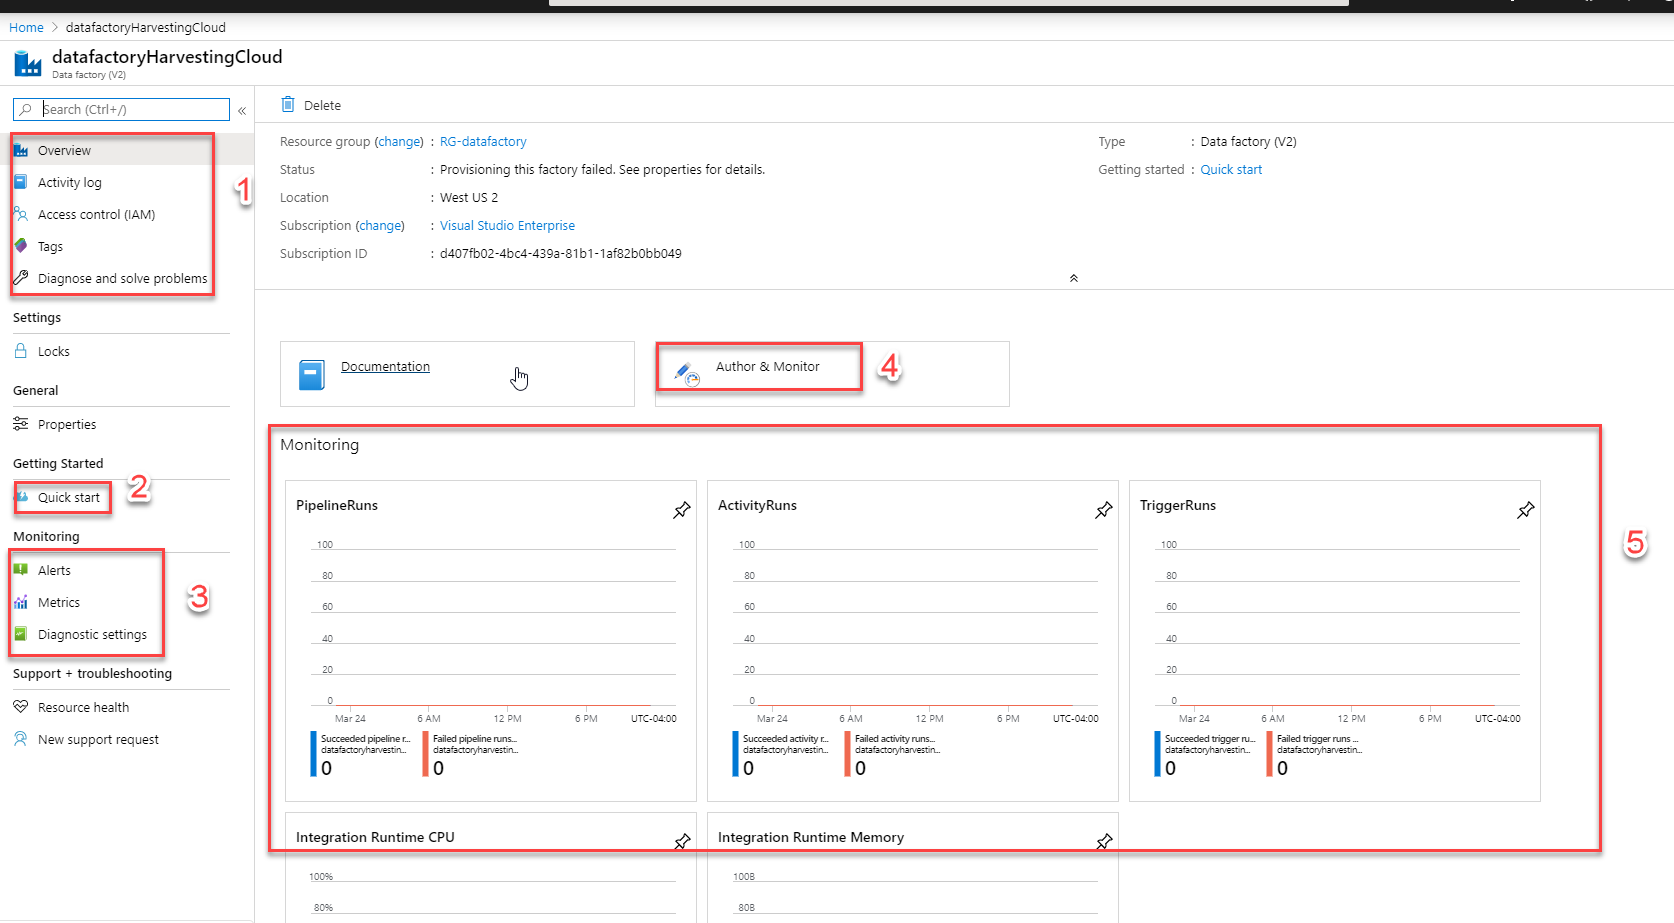
Section 1: General properties
- Overview: The first page when you land on this window is the overview page.
- Activity log: Platform logs provide detailed diagnostic and auditing information for Azure resources and the Azure platform they depend on. They are automatically generated although you need to configure certain platform logs to be forwarded to one or more destinations to be retained.
- Access Control (IAM): Review the level of access a user, group, service principal, or managed identity has to this resource.
- Tags: This is used to provide some keywords to your resource.
- Diagnostic and solve problems: This provides you the list of troubleshooting links for the known issues a user can come across.
Section 2 Getting Started
Quick Start: This provide the basic tutorial/videos link on how to work with the Data factory. They have been provided by Microsoft and you can see the documentation about the subject. It is really helpful as it gives a quick understanding of the topic.
Section 3 Monitoring
- Alerts: Configure alert rules and attend to fired alerts to efficiently monitor your Azure resources.
- Metrics: Configure alert rules and attend to fired alerts to efficiently monitor yourAzure resources. For more details, please refer to the Microsoft official documentation for Metrics at https://docs.microsoft.com/en-us/azure/azure-monitor/platform/metrics-getting-started
- Diagnostic settings: They are used to collect platform logs and metrics in Azure. To get more information on how to create the diagnostic settings using Azure Portal/CLI/Powershell, please refer to the official Microsoft documentation at https://docs.microsoft.com/en-us/azure/azure-monitor/platform/diagnostic-settings
Section 4 Author & Monitor
Author and Monitor link is the most important link which takes you to the authoring console. This console opens up the new window. This is where you can create Azure-SSIS IR, pipelines, linked services, data sets, and data flow, etc. I will be explaining this more in the upcoming posts.
Section 5 Monitoring
This section is the summarization of the activities happening in the Azure Data Factory. Pipelines status whether it was successful or failed. TriggerRun information that when the pipelines ran. You can also check the CPU and Memory utilization of the IR. You can view or set up all these monitoring status on the Metrics mentioned in section 3.