Azure for AWS professionals - Virtual Machines vs EC2 instances - 06 - Monitoring of Azure VMs
@20aman May 25, 2019Note that this post is a part of the series. You can view all posts in this series here: Azure for AWS professionals - Index
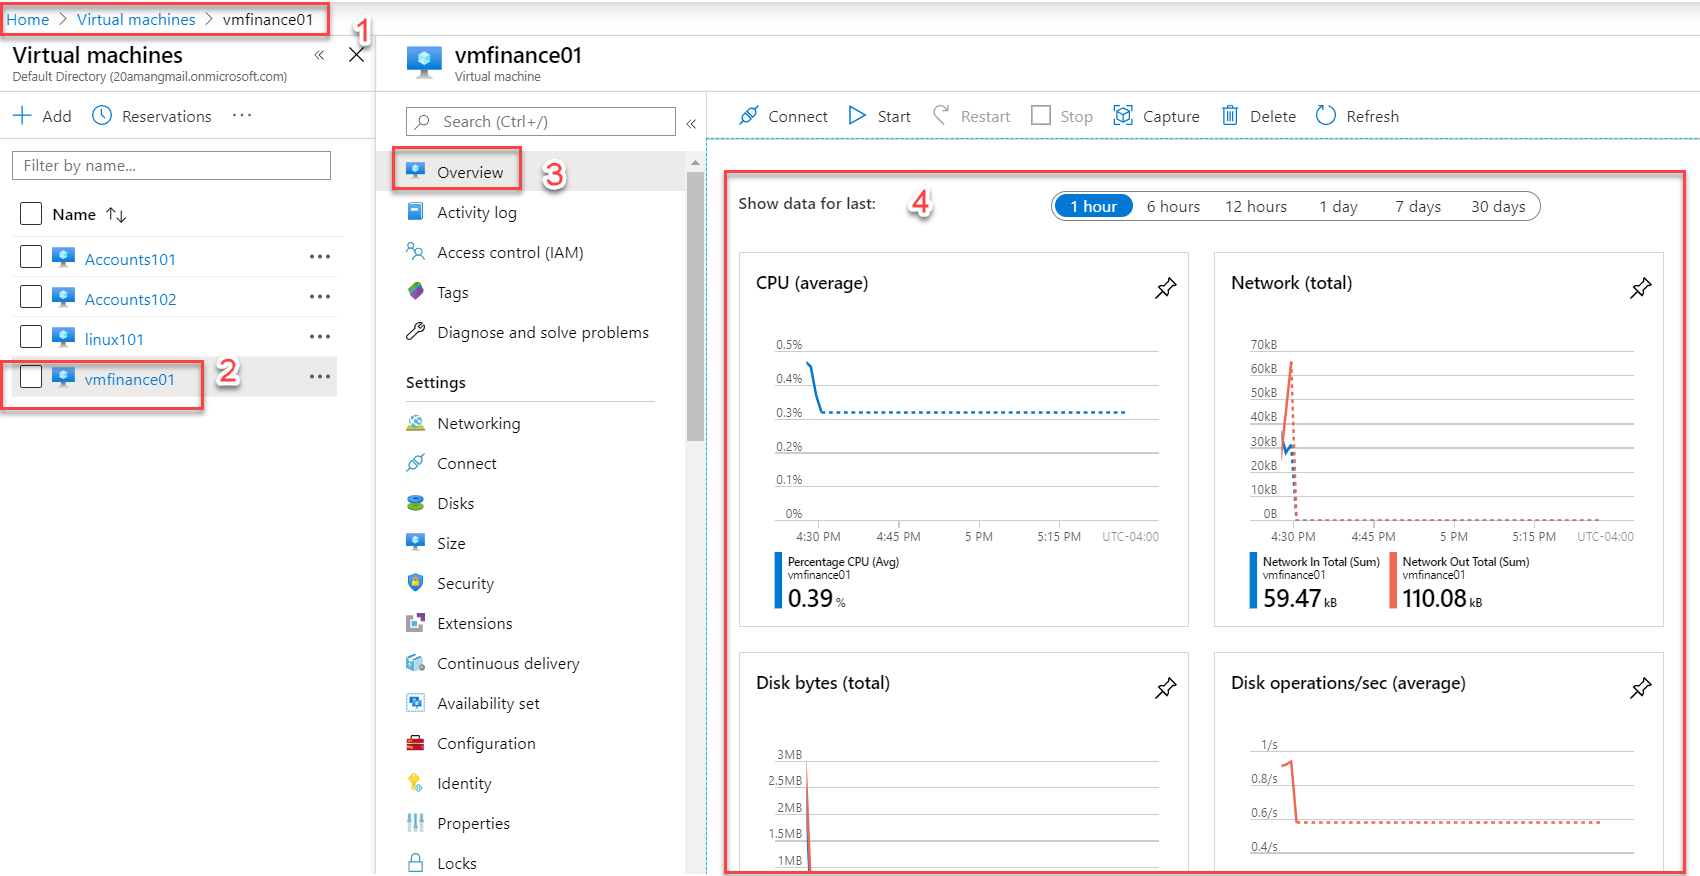
Within Azure, when you click on the Virtual Machine, you have a lot of control of various aspects of the VM right from one screen. When you navigate to the Azure Virtual Machines section, you are presented with all the virtual machines in your environment. Here when you click on any one VM, a new screen pops up. Microsoft calls this as new Blade. In this blade, the Overview section is the first one and is selected by default. It shows you lots of information for the VM like it's a subscription, resource group, public and private IP address, a button to connect to the VM, etc.
When you scroll a little bit down you get the out of the box metrics for the VM. These metrics include CPU data, Network data, Disk IOPS, etc. You also have time filter at the top.

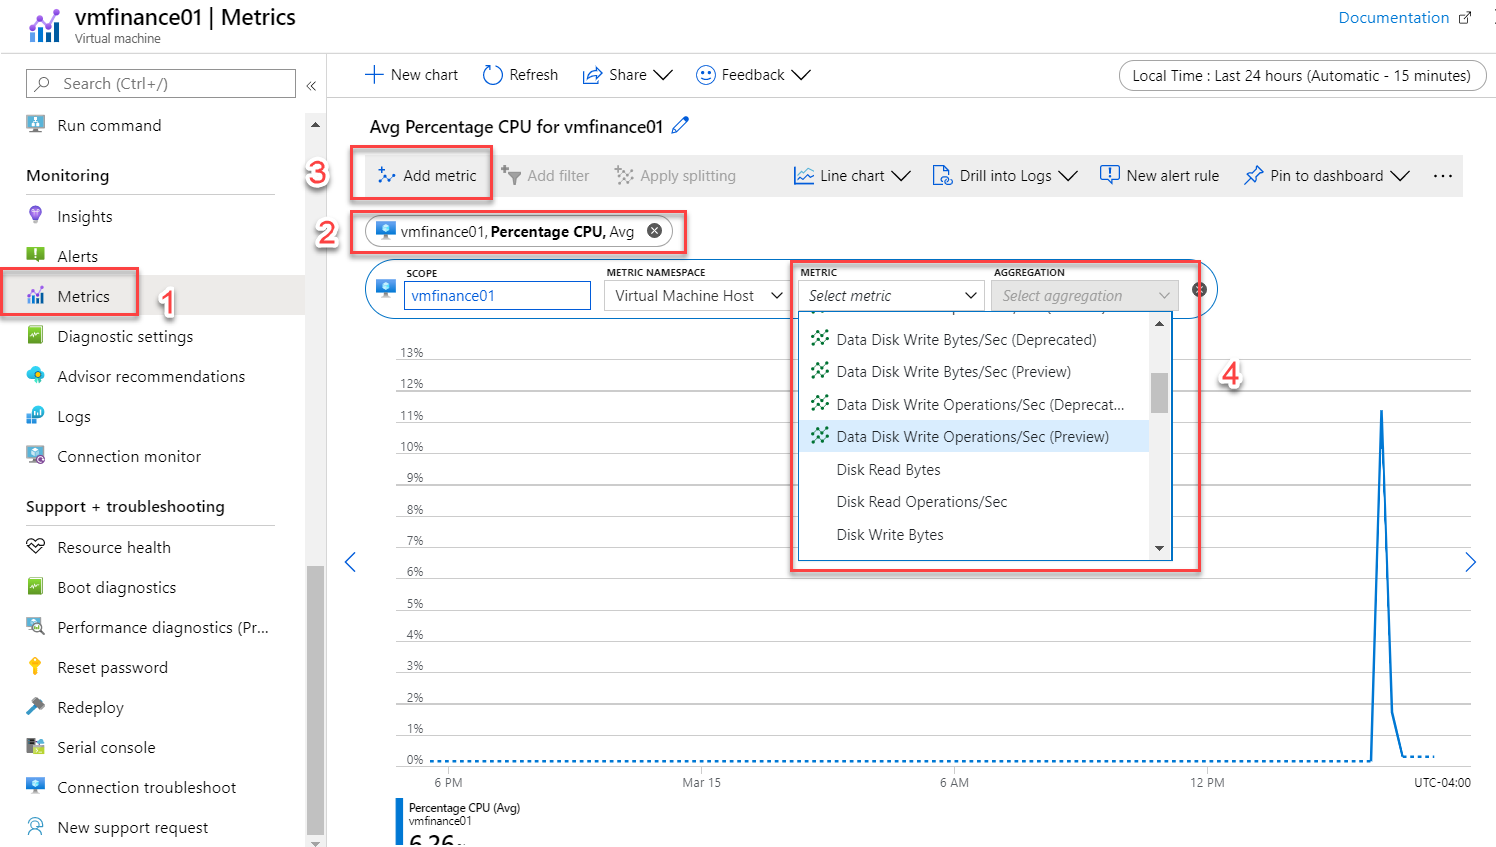
From the left-hand side menu of the selected Virtual Machine, scroll down to the Monitoring section. This has loads of information and options. The key option you want to explore is the "Metrics" option. Here you can build custom graphs to monitor different metrics by adding each one. Click on Add Metrics and select the same from the drop-down list. The graph will update to show all the selected matrices.

We will explore more options in the subsequent posts as well.
For more information, refer to the below links: Microsoft Azure Virtual Machines