SQL insights in Azure Monitor
@20aman Mar 18, 2021Microsoft Azure Monitor now has SQL monitoring capabilities. This feature is provided out of the box now.
Using this you can monitor:
- Azure SQL Databases
- Azure SQL Managed Instance
- SQL Server on Azure VM
Now you can monitor things like:
- CPU Utilization percentage
- Memory Utilization percentage
- Data IO percentage
- Number of User Connections
- Active Temp Tables
- Memory Grants Pending
- Processes blocked
- Deadlocks/sec
- Total data file size
- Total log file size
- Total log file used size
- Free space in tempdb
- Memory broker clerk size, etc.
Where are the SQL Insights
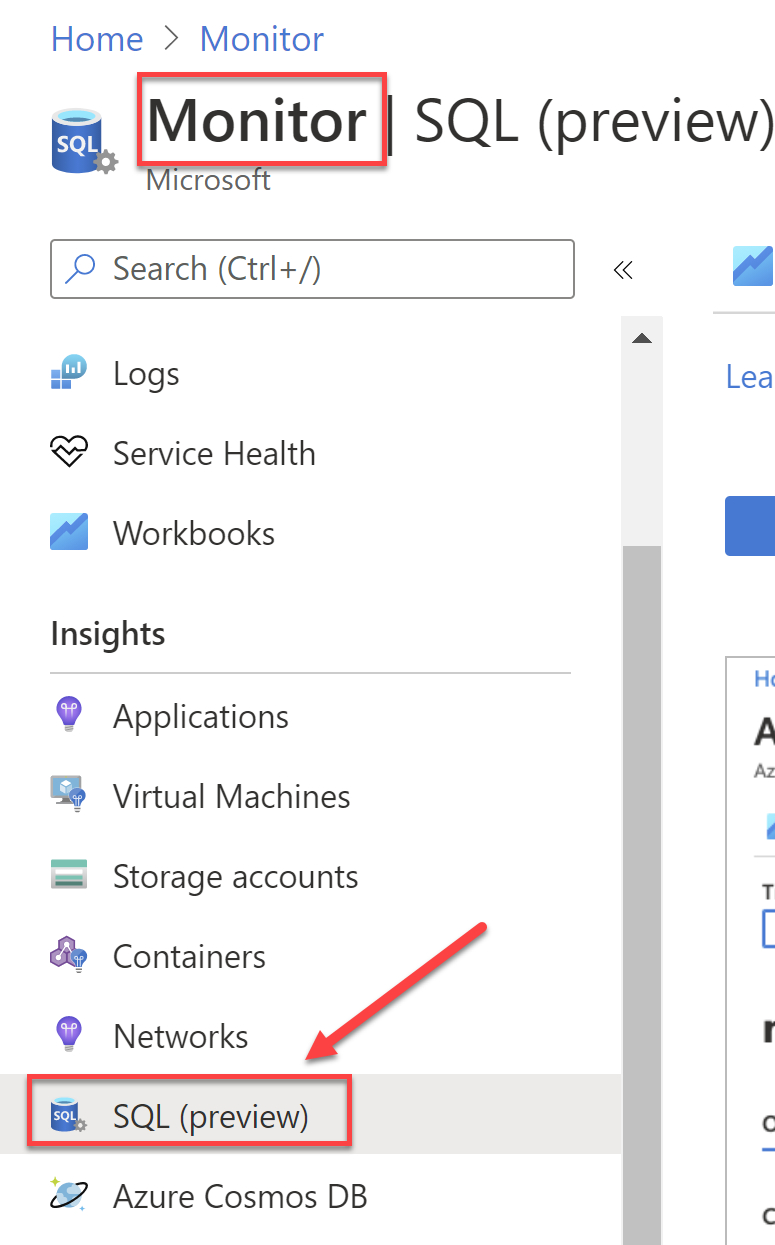
You can access the SQL insights by navigating to the Monitor in the Azure portal. And then in the Insights section, you can navigate to the "SQL (preview)" option.

Pricing
There is no separate pricing for the SQL Insights. All costs are incurred by the virtual machines that gather the data, the Log Analytics workspaces that store the data, and any alert rules configured on the data.
You can learn more about the SQL insights from the official documentation here: Monitor your SQL deployments with SQL insights